No Scope, Less Competition: What Changed in New Mexico’s Muzzleloader Draw
Share this article
Fewer resident applicants. Better draw rates. Lower reported success. Eight years of New Mexico draw data, and seven of harvest data, on what the scope ban actually changed.
In 2022, the New Mexico State Game Commission voted to ban scopes on muzzleloaders. The ban officially went into effect for the 2023 season and has remained in place. Following the scope ban, fewer resident hunters selected muzzleloader hunts as their first choice—and demand stayed lower. For hunters willing to use open or peep sights, some elk and deer hunts deserve another look.
So did the tags actually get easier to draw? Hunt Smart NM went through the official draw reports for 2019 through 2026, and the harvest reports for 2019 through 2025, hunt by hunt. For residents, yes—most muzzleloader hunts became easier to draw, but that is only half the story.
The field thinned out fast, and stayed thin
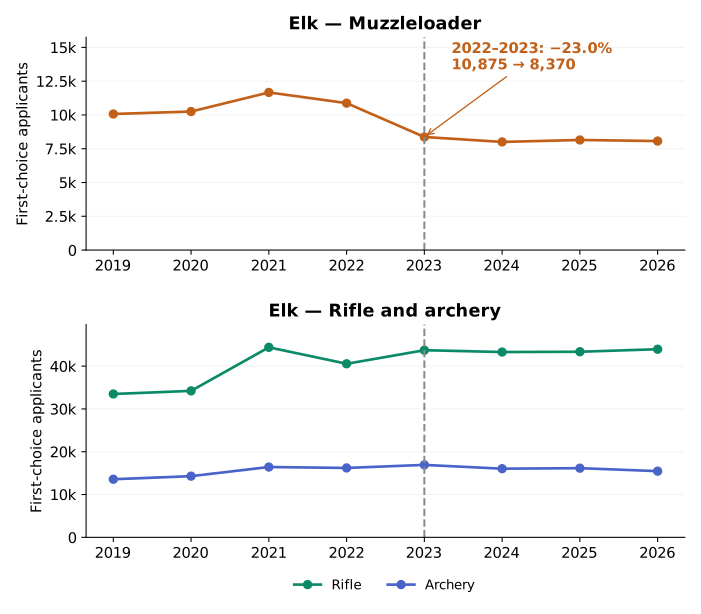
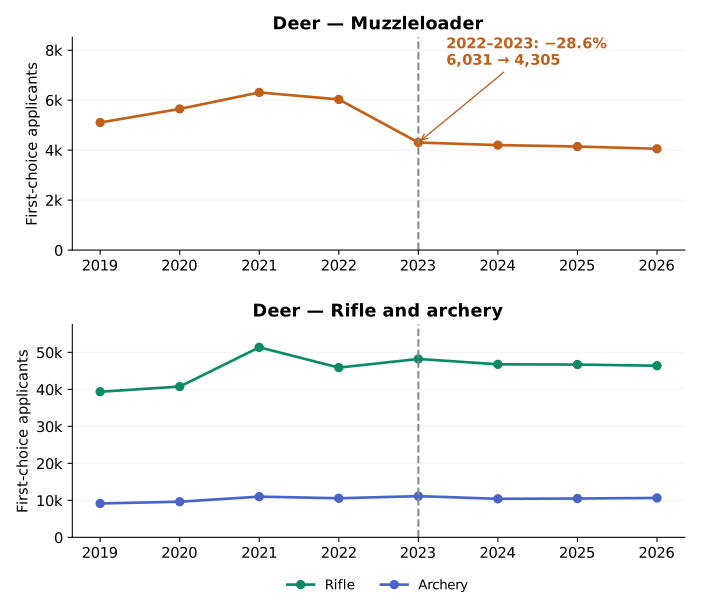
The drop was immediate. From the 2022 draw to the 2023 draw — the first one held under the ban — resident first-choice applicants fell 23.0% for elk and 28.6% for deer.
| Resident first-choice applicants [11] | 2022 | 2023 |
|---|---|---|
| Elk | 10,875 | 8,370 |
| Deer | 6,031 | 4,305 |
Nothing similar happened to the other weapons. In that same year, resident first-choice applicants rose 7.8% for elk and 5.1% for deer in rifle hunts, and 4.4% and 5.4% in archery hunts. Hunters were not leaving the draw. They were leaving muzzleloader hunts.
Two qualifications belong here. Muzzleloader applications had already slipped from 2021 to 2022, so the decline did not begin with the ban. And the number of tags available to applicants barely moved: included elk hunts offered 4,210 licenses in 2022 and 4,171 in 2023, while deer went from 4,755 to 4,845. A supply cut cannot explain a quarter of the field disappearing.
The field has not come back. By 2026 — four draws under the ban — resident first-choice applicants totaled 8,069 for elk and 4,055 for deer, still 25.8% and 32.8% below the 2022 pre-ban levels.
Fewer applicants, better odds
Fewer people chasing roughly the same number of tags is exactly what it sounds like. Comparing the four draws before the ban with the four draws under it, the share of residents who drew the muzzleloader hunt they listed first rose for both species.
RESIDENT FIRST CHOICE DRAW RATES BEFORE AND AFTER THE SCOPE BAN
The percentage of residents who drew the hunt they listed as their first choice.
| Pre-ban 2019–2022 | Post-ban 2023–2026 | |
|---|---|---|
| Muzzleloader | 17.56% | 21.84% |
| Archery | 24.15% | 23.09% |
| Rifle | 13.51% | 12.06% |
| Pre-ban 2019–2022 | Post-ban 2023–2026 | |
|---|---|---|
| Muzzleloader | 37.68% | 43.18% |
| Archery | 31.29% | 29.68% |
| Rifle | 21.10% | 18.66% |
Residents were more likely to draw their first-choice muzzleloader hunt after the ban. The draw rate rose 4.28 percentage points for elk and 5.50 for deer. Archery and rifle moved the other way in both species over the same period. That contrast is the strongest evidence in this analysis that something specific to muzzleloader hunts changed in 2023.
The tags got easier to draw. They did not get easier to fill.
This is the part worth slowing down for, because it cuts against the headline. Across the same hunts, average reported harvest success went down after the ban. Hunt Smart NM compared 2019–2022 with 2023–2025, using the 45 elk and 54 deer hunts with published results in both periods. Completed 2026-season results are not yet available. [10]
| Species | Pre-ban | Post-ban | Change |
|---|---|---|---|
| Elk | 30.7% | 26.4% | −4.2 points |
| Deer | 32.0% | 26.2% | −5.7 points |
Success was lower in 33 of the 45 elk hunts and 40 of the 54 deer hunts. That includes the hunts where drawing got easier: of the 82 hunts whose resident draw rate improved, reported success still fell in 61.
The two species then part company. Elk success fell hard in 2023, to 25.6%, and has largely recovered — 29.3% in 2025, close to its pre-ban level. That pattern looks like a learning curve: a weapon got harder to shoot well, and hunters adjusted. Deer has not recovered. It ran 28.9% in 2023 and 23.2% in 2025, its lowest year in the series. But deer success was already sliding before the ban — 34.0% and 34.5% in 2019 and 2020, then 29.1% and 30.2% in 2021 and 2022 — so read the deer decline with more caution than the elk one.
These are averages of the department’s published hunt success rates, each hunt weighted equally, and they combine applicant pools — they are not resident-only. Changes are calculated before rounding, so they will not always match the difference between the two displayed figures. Weather, herd conditions, access and season changes all move harvest numbers, so this comparison cannot tell you how much of the decline the ban caused. What it does tell you is practical: a better draw rate is not the same thing as a better season.
Where the change actually helped
Statewide averages hide a lot. Three hunts show the range.
The Unit 16E mature bull elk hunt is the clearest win. Average annual first-choice applicants fell from about 87 to 58, and the resident draw rate went from 21.8% to 42.0% — from a long shot to close to a coin flip.
The Unit 34 either-sex elk hunt shows the limit. Applicants fell from roughly 1,492 to 1,067 and the draw rate rose from 11.1% to 14.0%. A real improvement, and most hunters who put it first still did not draw it. Easing competition on a very popular hunt does not make it an easy hunt.
The Unit 15 deer hunt went the other way entirely. It drew 6.6% more resident first-choice applicants after the ban, and its draw rate fell from 38.0% to 35.4%.
Unit 15 is not alone. Of the 99 hunts with records in all eight years, 91 had lower average resident first-choice demand after the ban and 8 had higher. The full tables below cover all 46 elk and 54 deer histories included in this analysis, including hunts with noted season, bag or license changes. One of them — a Unit 37 mature bull elk hunt — was discontinued after 2022, which is why some comparisons here count 99 hunts rather than 100, and 45 elk hunts rather than 46.
Nonresidents got a different deal
The exodus was mostly a resident phenomenon. In the nonresident pool outside the outfitter pool, average first-choice applicants fell only 3.0% for elk and 9.0% for deer.
The results split. The nonresident deer rate improved from 29.08% to 36.61%. The nonresident elk rate slipped from 3.49% to 3.25% — it did not improve at all. If you apply as a nonresident for elk, the resident headline does not describe your odds. The outfitter pool, which can include residents and nonresidents, is reported separately in the downloadable tables.
Putting this to work
The timing and the contrast with rifle and archery support the idea that the ban drove down muzzleloader demand. Other rules, seasons and license numbers changed too, so this cannot measure how much of the decline the ban caused. [1, 3, 6]
If you are willing to hunt with open or peep sights, the practical move is to reopen hunts you wrote off when they looked hopeless. Three questions will tell you whether a hunt is worth an application:
- Did its draw rate actually move? Some hunts gained twenty points. Some lost ground. The draw-rate column in the tables below shows the before and after side by side.
- Is it attainable now, or just less impossible? A rate that went from 11% to 14% is still a long shot. One that went from 22% to 42% is a different decision.
- Can you fill the tag? Check the hunt’s reported success, not just its draw rate. Those are separate questions, and this analysis says they moved in opposite directions.
Then confirm the dates, bag limit and eligibility for your own applicant pool before you apply. Use Hunt Explorer to compare individual hunts, and Draw Strategy to test all three of your choices together through its separate experimental simulation. Historical draw rates for individual choices cannot simply be added to calculate your chance of drawing a tag.
Explore the elk and deer muzzleloader hunts
All 100 elk and deer hunt histories are below, including discontinued hunts recorded during 2019–2026. These tables show the resident pool; download the calculations for the nonresident and outfitter pools. Private-land-only deer hunts, hunts where scopes were already prohibited, hunts added after the ban, and the three Marquez/L-Bar elk histories are excluded throughout — see Sources and methodology for why.
Before: 2019–2022. After: 2023–2026. Applicants are annual averages across the years actually reported; rates divide total first-choice awards by total first-choice entries. Missing years are identified. A dash means there is no comparison or no entries from which to calculate a rate.
Elk: all 46 hunt histories
On small screens, scroll the table sideways to see each comparison and its notes. First, second and third identify season order for hunts with the same location, bag limit and eligibility. Year-specific dates remain in the downloadable records.
| HUNT | Average applicants before → after scope ban | Change in applicants | Draw rate before → after | Comparison notes |
|---|---|---|---|---|
| Unit 2 — Mature Bull | 460.8 → 385.5 | -16.3% | 13.9% → 18.9% | Licenses varied: 125–135. Years in averages: 4 before, 4 after. |
| Unit 6A — Mature Bull | 532.5 → 506.0 | -5.0% | 12.6% → 13.0% | Annual hunt rows checked; calendar dates vary by year. Years in averages: 4 before, 4 after. |
| Unit 6B — Either Sex | 735.2 → 530.8 | -27.8% | 1.7% → 2.4% | Annual hunt rows checked; calendar dates vary by year. Years in averages: 4 before, 4 after. |
| Unit 6C — Mature Bull | 243.8 → 224.5 | -7.9% | 27.2% → 25.8% | Annual hunt rows checked; calendar dates vary by year. Years in averages: 4 before, 4 after. |
| Unit 7 — Mature Bull | 21.2 → 27.0 | +27.1% | 35.3% → 32.4% | Annual hunt rows checked; calendar dates vary by year. Years in averages: 4 before, 4 after. |
| Unit 9, including Water Canyon WMA — First Mature Bull | 40.2 → 38.2 | -5.0% | 47.8% → 49.0% | Licenses varied: 35–50. Years in averages: 4 before, 4 after. |
| Unit 9, including Water Canyon WMA — Second Mature Bull | 13.8 → 16.5 | +20.0% | 96.4% → 71.2% | Licenses varied: 35–50. Years in averages: 4 before, 4 after. |
| Unit 9, including Water Canyon WMA — Third Mature Bull | 13.8 → 12.0 | -12.7% | 98.2% → 56.2% | Licenses varied: 21–30. Years in averages: 4 before, 4 after. |
| Unit 9, including Water Canyon WMA - mobility impaired only — Mature Bull | 12.8 → 11.0 | -13.7% | 98.0% → 81.8% | Bag changed: ES → MB; Licenses varied: 21–30. Years in averages: 4 before, 4 after. |
| Unit 10 — Mature Bull | 223.8 → 161.0 | -28.0% | 20.4% → 23.9% | Annual hunt rows checked; calendar dates vary by year. Years in averages: 4 before, 4 after. |
| Unit 13 — First Mature Bull | 432.5 → 338.8 | -21.7% | 11.8% → 16.3% | Licenses varied: 80–86. Years in averages: 4 before, 4 after. |
| Unit 13 — Second Mature Bull | 90.2 → 85.8 | -5.0% | 29.4% → 34.1% | Licenses varied: 117–126. Years in averages: 4 before, 4 after. |
| Unit 13 — Third Mature Bull | 83.0 → 62.5 | -24.7% | 43.1% → 50.8% | Licenses varied: 117–126. Years in averages: 4 before, 4 after. |
| Unit 13 — First Antlerless | 149.2 → 106.8 | -28.5% | 36.5% → 52.2% | Licenses varied: 110–117; New Mexico residents only. Years in averages: 4 before, 4 after. |
| Unit 13 — Second Antlerless | 33.8 → 34.8 | +3.0% | 59.3% → 81.3% | Licenses varied: 108–116; New Mexico residents only. Years in averages: 4 before, 4 after. |
| Unit 13 youth only — Either Sex | 145.2 → 113.8 | -21.7% | 11.9% → 16.3% | Annual hunt rows checked; calendar dates vary by year. Years in averages: 4 before, 4 after. |
| Unit 15 — First Mature Bull | 1,643.0 → 1,291.5 | -21.4% | 8.8% → 11.1% | Annual hunt rows checked; calendar dates vary by year. Years in averages: 4 before, 4 after. |
| Unit 15 — Second Mature Bull | 227.8 → 199.0 | -12.6% | 22.9% → 31.3% | Annual hunt rows checked; calendar dates vary by year. Years in averages: 4 before, 4 after. |
| Unit 15 — Third Mature Bull | 193.2 → 153.2 | -20.7% | 38.2% → 46.0% | Season timing changed beyond the usual annual calendar shift. Years in averages: 4 before, 4 after. |
| Unit 15 — First Antlerless | 563.2 → 452.5 | -19.7% | 27.7% → 32.5% | New Mexico residents only. Years in averages: 4 before, 4 after. |
| Unit 15 — Second Antlerless | 111.8 → 94.8 | -15.2% | 51.7% → 57.5% | New Mexico residents only. Years in averages: 4 before, 4 after. |
| Unit 15 youth only — Either Sex | 352.2 → 248.8 | -29.4% | 5.6% → 7.5% | Annual hunt rows checked; calendar dates vary by year. Years in averages: 4 before, 4 after. |
| Unit 16E — Mature Bull | 87.2 → 57.8 | -33.8% | 21.8% → 42.0% | Annual hunt rows checked; calendar dates vary by year. Years in averages: 4 before, 4 after. |
| Unit 17 — First Mature Bull | 365.2 → 212.5 | -41.8% | 15.7% → 20.8% | Annual hunt rows checked; calendar dates vary by year. Years in averages: 4 before, 4 after. |
| Unit 17 — Second Mature Bull | 69.2 → 52.0 | -24.9% | 32.9% → 49.5% | Annual hunt rows checked; calendar dates vary by year. Years in averages: 4 before, 4 after. |
| Unit 17 — First Antlerless | 60.5 → 44.2 | -26.9% | 28.9% → 32.8% | New Mexico residents only. Years in averages: 4 before, 4 after. |
| Unit 17 — Third Mature Bull | 57.0 → 34.0 | -40.4% | 21.5% → 33.1% | Annual hunt rows checked; calendar dates vary by year. Years in averages: 4 before, 4 after. |
| Unit 17 — Second Antlerless | 57.2 → 42.0 | -26.6% | 55.9% → 66.7% | New Mexico residents only. Years in averages: 4 before, 4 after. |
| Unit 17 — Third Antlerless | 26.0 → 19.8 | -24.0% | 78.8% → 89.9% | New Mexico residents only. Years in averages: 4 before, 4 after. |
| Unit 17 youth only — Either Sex | 90.2 → 61.5 | -31.9% | 12.7% → 17.1% | Annual hunt rows checked; calendar dates vary by year. Years in averages: 4 before, 4 after. |
| Unit 23 — Mature Bull | 37.8 → 36.5 | -3.3% | 49.0% → 50.0% | Annual hunt rows checked; calendar dates vary by year. Years in averages: 4 before, 4 after. |
| Unit 24: excluding Ft. Bayard management area — Mature Bull | 12.0 → 15.2 | +27.1% | 50.0% → 32.8% | Annual hunt rows checked; calendar dates vary by year. Years in averages: 4 before, 4 after. |
| Unit 34 — Either Sex | 1,491.5 → 1,067.2 | -28.4% | 11.1% → 14.0% | Annual hunt rows checked; calendar dates vary by year. Years in averages: 4 before, 4 after. |
| Unit 36 — Either Sex | 506.0 → 447.5 | -11.6% | 15.8% → 18.8% | Bag changed: MB → ES. Years in averages: 4 before, 4 after. |
| Unit 37 — Mature Bull | 147.8 → — | — | 13.5% → — | No muzzleloader record after 2022; Years present: 2019, 2020, 2021, 2022. Years in averages: 4 before, 0 after. |
| Unit 45 — Mature Bull | 169.0 → 134.8 | -20.3% | 38.2% → 41.7% | Annual hunt rows checked; calendar dates vary by year. Years in averages: 4 before, 4 after. |
| Unit 45 — Antlerless | 86.2 → 58.0 | -32.8% | 32.5% → 40.9% | New Mexico residents only. Years in averages: 4 before, 4 after. |
| Unit 48 — Mature Bull | 86.2 → 62.2 | -27.8% | 31.0% → 47.4% | Licenses varied: 50–60. Years in averages: 4 before, 4 after. |
| Unit 51 — Either Sex | 166.8 → 119.5 | -28.3% | 39.4% → 42.5% | Annual hunt rows checked; calendar dates vary by year. Years in averages: 4 before, 4 after. |
| Unit 52 — Antlerless | 96.0 → 73.5 | -23.4% | 28.4% → 39.1% | New Mexico residents only. Years in averages: 4 before, 4 after. |
| Unit 52 — Mature Bull | 321.0 → 256.5 | -20.1% | 22.0% → 26.5% | Annual hunt rows checked; calendar dates vary by year. Years in averages: 4 before, 4 after. |
| Unit 52 mobility impaired only — Mature Bull | 33.2 → 31.2 | -6.0% | 60.9% → 74.4% | Annual hunt rows checked; calendar dates vary by year. Years in averages: 4 before, 4 after. |
| Unit 53: excluding Cerro portion — Either Sex | 72.2 → 37.5 | -48.1% | 39.8% → 56.7% | Annual hunt rows checked; calendar dates vary by year. Years in averages: 4 before, 4 after. |
| Unit 54/55A: Colin Neblett WMA only — Mature Bull | 15.2 → 7.2 | -52.5% | 83.6% → 75.9% | Licenses varied: 20–40; Area/access wording changed; inspect annual descriptions. Years in averages: 4 before, 4 after. |
| Unit 55A: Urraca WMA only — Mature Bull | 15.8 → 10.8 | -31.7% | 47.6% → 58.1% | Annual hunt rows checked; calendar dates vary by year. Years in averages: 4 before, 4 after. |
| Unit 55A: Valle Vidal only — Mature Bull | 325.0 → 172.0 | -47.1% | 4.9% → 8.7% | Valle Vidal eligibility restrictions apply. Years in averages: 4 before, 4 after. |
Deer: all 54 hunt histories
On small screens, scroll the table sideways to see each comparison and its notes. First, second and third identify season order for hunts with the same location, bag limit and eligibility. Year-specific dates remain in the downloadable records.
| HUNT | Average applicants before → after scope ban | Change in applicants | Draw rate before → after | Comparison notes |
|---|---|---|---|---|
| Unit 2A | 65.5 → 50.2 | -23.3% | 34.4% → 42.8% | Annual hunt rows checked; calendar dates vary by year. Years in averages: 4 before, 4 after. |
| Unit 2B | 231.2 → 133.0 | -42.5% | 31.0% → 45.3% | Annual hunt rows checked; calendar dates vary by year. Years in averages: 4 before, 4 after. |
| Unit 2B: youth only | 21.5 → 10.2 | -52.3% | 36.0% → 70.7% | Annual hunt rows checked; calendar dates vary by year. Years in averages: 4 before, 4 after. |
| Unit 2C | 259.8 → 151.2 | -41.8% | 4.0% → 6.9% | Annual hunt rows checked; calendar dates vary by year. Years in averages: 4 before, 4 after. |
| Unit 5A: public land only | 29.2 → 15.5 | -47.0% | 15.4% → 29.0% | Annual hunt rows checked; calendar dates vary by year. Years in averages: 4 before, 4 after. |
| Unit 5B | 184.0 → 116.8 | -36.5% | 3.8% → 6.0% | Annual hunt rows checked; calendar dates vary by year. Years in averages: 4 before, 4 after. |
| Units 6A and 6C | 533.8 → 484.0 | -9.3% | 12.8% → 12.4% | Annual hunt rows checked; calendar dates vary by year. Years in averages: 4 before, 4 after. |
| Unit 7 | 30.0 → 28.2 | -5.8% | 21.7% → 37.2% | Licenses varied: 20–25. Years in averages: 4 before, 4 after. |
| Unit 10 | 237.0 → 172.2 | -27.3% | 24.4% → 32.9% | Annual hunt rows checked; calendar dates vary by year. Years in averages: 4 before, 4 after. |
| Unit 12 | 10.5 → 16.2 | +54.8% | 76.2% → 80.0% | Season timing changed beyond the usual annual calendar shift. Years in averages: 4 before, 4 after. |
| Unit 13 | 164.2 → 130.0 | -20.9% | 54.3% → 63.8% | Annual hunt rows checked; calendar dates vary by year. Years in averages: 4 before, 4 after. |
| Unit 14 | 437.5 → 335.0 | -23.4% | 7.5% → 9.9% | Licenses varied: 50–55. Years in averages: 4 before, 4 after. |
| Unit 15 | 279.8 → 298.2 | +6.6% | 38.0% → 35.4% | Annual hunt rows checked; calendar dates vary by year. Years in averages: 4 before, 4 after. |
| Unit 15: youth only | 32.2 → 18.0 | -44.2% | 58.1% → 100.0% | Annual hunt rows checked; calendar dates vary by year. Years in averages: 4 before, 4 after. |
| Unit 16 | 305.0 → 249.2 | -18.3% | 53.1% → 58.0% | Annual hunt rows checked; calendar dates vary by year. Years in averages: 4 before, 4 after. |
| Unit 17 | 397.8 → 205.2 | -48.4% | 12.8% → 21.1% | Annual hunt rows checked; calendar dates vary by year. Years in averages: 4 before, 4 after. |
| Unit 18 | 45.0 → 33.8 | -25.0% | 60.0% → 68.9% | Annual hunt rows checked; calendar dates vary by year. Years in averages: 4 before, 4 after. |
| Unit 19: except the White Sands missile range portion and Ft. Bliss | 105.0 → 112.5 | +7.1% | 5.0% → 5.6% | Area/access wording changed; inspect annual descriptions. Years in averages: 4 before, 4 after. |
| Unit 20 | 63.2 → 38.8 | -38.7% | 57.3% → 72.9% | Annual hunt rows checked; calendar dates vary by year. Years in averages: 4 before, 4 after. |
| Unit 21 | 99.8 → 70.8 | -29.1% | 98.7% → 99.6% | Annual hunt rows checked; calendar dates vary by year. Years in averages: 4 before, 4 after. |
| Unit 22 | 18.5 → 14.2 | -23.0% | 97.3% → 96.5% | Annual hunt rows checked; calendar dates vary by year. Years in averages: 4 before, 4 after. |
| Unit 23: Burro mountains hunt area only — Mule Deer | 84.5 → 66.8 | -21.0% | 28.7% → 32.2% | Annual hunt rows checked; calendar dates vary by year. Years in averages: 4 before, 4 after. |
| Unit 23: Burro mountains hunt area only — White-Tailed Deer | 29.8 → 26.8 | -10.1% | 42.0% → 81.3% | Annual hunt rows checked; calendar dates vary by year. Years in averages: 4 before, 4 after. |
| Unit 23: except the Burro mountains hunt area — Mule Deer | 84.8 → 42.0 | -50.4% | 99.4% → 99.4% | Annual hunt rows checked; calendar dates vary by year. Years in averages: 4 before, 4 after. |
| Unit 23: except the Burro mountains hunt area — White-Tailed Deer | 13.5 → 7.0 | -48.1% | 100.0% → 100.0% | Licenses varied: 45–75. Years in averages: 4 before, 4 after. |
| Unit 24: excluding Fort Bayard management area — Mule Deer | 96.2 → 65.2 | -32.2% | 87.5% → 100.0% | Annual hunt rows checked; calendar dates vary by year. Years in averages: 4 before, 4 after. |
| Unit 24: excluding Fort Bayard management area — White-Tailed Deer | 15.0 → 10.0 | -33.3% | 68.3% → 100.0% | Licenses varied: 40–75. Years in averages: 4 before, 4 after. |
| Unit 25 | 27.0 → 14.8 | -45.4% | 64.8% → 96.6% | Annual hunt rows checked; calendar dates vary by year. Years in averages: 4 before, 4 after. |
| Unit 26 | 19.8 → 6.5 | -67.1% | 70.9% → 100.0% | Annual hunt rows checked; calendar dates vary by year. Years in averages: 4 before, 4 after. |
| Unit 27 — Mule Deer | 16.5 → 8.5 | -48.5% | 95.5% → 97.1% | Annual hunt rows checked; calendar dates vary by year. Years in averages: 4 before, 4 after. |
| Unit 27 — White-Tailed Deer | 19.8 → 7.5 | -62.0% | 83.5% → 100.0% | Annual hunt rows checked; calendar dates vary by year. Years in averages: 4 before, 4 after. |
| Unit 29 | 11.8 → 4.2 | -63.8% | 100.0% → 100.0% | 2025 season starts a week earlier in the annual calendar sequence. Years in averages: 4 before, 4 after. |
| Unit 30 | 235.5 → 122.2 | -48.1% | 75.7% → 99.4% | 2025 season starts a week earlier in the annual calendar sequence. Years in averages: 4 before, 4 after. |
| Unit 31, including Prairie Chicken WMAs | 250.0 → 106.0 | -57.6% | 42.3% → 72.4% | Area/access wording changed; inspect annual descriptions; 2025 season starts a week earlier in the annual calendar sequence. Years in averages: 4 before, 4 after. |
| Unit 32, including Prairie Chicken WMAs | 122.2 → 60.5 | -50.5% | 74.8% → 99.6% | Area/access wording changed; inspect annual descriptions; 2025 season starts a week earlier in the annual calendar sequence. Years in averages: 4 before, 4 after. |
| Unit 33: Huey WMA only, youth only — Either Sex | 23.2 → 18.8 | -19.4% | 25.8% → 24.0% | Licenses varied: 5–10; New Mexico resident youth only. Years in averages: 4 before, 4 after. |
| Unit 33: Huey WMA only, youth only — Antlerless | 1.5 → 0.8 | -50.0% | 16.7% → 100.0% | Licenses varied: 5–10; New Mexico resident youth only. Years in averages: 4 before, 4 after. |
| Unit 34 | 204.8 → 204.2 | -0.2% | 81.6% → 81.2% | Annual hunt rows checked; calendar dates vary by year. Years in averages: 4 before, 4 after. |
| Unit 36 | 139.0 → 115.0 | -17.3% | 53.4% → 54.6% | Area/access wording changed; inspect annual descriptions. Years in averages: 4 before, 4 after. |
| Unit 36: youth only | 15.5 → 5.8 | -62.9% | 62.9% → 100.0% | Area/access wording changed; inspect annual descriptions. Years in averages: 4 before, 4 after. |
| Unit 37 | 162.0 → 95.2 | -41.2% | 48.6% → 68.0% | Annual hunt rows checked; calendar dates vary by year. Years in averages: 4 before, 4 after. |
| Unit 38 | 58.8 → 22.5 | -61.7% | 69.4% → 98.9% | Annual hunt rows checked; calendar dates vary by year. Years in averages: 4 before, 4 after. |
| Unit 39 | 10.8 → 9.2 | -14.0% | 97.7% → 100.0% | Annual hunt rows checked; calendar dates vary by year. Years in averages: 4 before, 4 after. |
| Unit 40 | 7.0 → 3.5 | -50.0% | 100.0% → 100.0% | Licenses varied: 25–30. Years in averages: 4 before, 4 after. |
| Unit 41 | 34.8 → 20.8 | -40.3% | 37.4% → 72.3% | Annual hunt rows checked; calendar dates vary by year. Years in averages: 4 before, 4 after. |
| Unit 42 | 8.0 → 5.2 | -34.4% | 62.5% → 90.5% | Licenses varied: 10–15. Years in averages: 4 before, 4 after. |
| Unit 43 | 20.8 → 20.5 | -1.2% | 28.9% → 41.5% | Licenses varied: 10–15. Years in averages: 4 before, 4 after. |
| Unit 45 | 382.0 → 327.2 | -14.3% | 28.4% → 29.4% | Annual hunt rows checked; calendar dates vary by year. Years in averages: 4 before, 4 after. |
| Unit 47 | 19.2 → 13.2 | -31.2% | 62.3% → 73.6% | Annual hunt rows checked; calendar dates vary by year. Years in averages: 4 before, 4 after. |
| Unit 48 | 64.8 → 56.8 | -12.4% | 27.0% → 36.1% | Licenses varied: 25–30. Years in averages: 4 before, 4 after. |
| Unit 56 | 6.5 → 2.0 | -69.2% | 69.2% → 100.0% | Licenses varied: 10–15. Years in averages: 4 before, 4 after. |
| Unit 57 (excluding Sugarite Canyon State Park) | 17.2 → 14.5 | -15.9% | 53.6% → 67.2% | Area/access wording changed; inspect annual descriptions. Years in averages: 4 before, 4 after. |
| Unit 58 | 21.8 → 7.0 | -67.8% | 70.1% → 100.0% | Annual hunt rows checked; calendar dates vary by year. Years in averages: 4 before, 4 after. |
| Unit 59 | 0.8 → 3.2 | +333.3% | 100.0% → 100.0% | Annual hunt rows checked; calendar dates vary by year. Years in averages: 4 before, 4 after. |
Share this article
Sources and methodology
[11] Counts represent individual hunters, including those applying together on group applications. Comparisons use first choices, with applicant pools analyzed separately. Back to table
Download all hunt comparisons and applicant pools (CSV)
Download all 796 annual records and source references (CSV)
The newsletter includes 796 elk and deer muzzleloader hunt-years: 364 elk and 432 deer. Each record belongs to exactly one of 100 hunt histories. Private-land-only deer hunts and previously scope-restricted muzzleloader hunts are excluded from the annual totals, all weapon comparisons, charts and downloadable tables. All included hunt-years have matching annual rulebook rows. Hunts introduced after the ban and the three Marquez/L-Bar elk histories affected by the 2023 area expansion are also excluded from the muzzleloader analysis. The full research inventory is preserved separately. The former minimum-demand and license-stability screens have been removed.
Hunts are linked by species, unit or named area, bag, eligibility and season sequence, with explicit old/new code mappings. Season changes, bag changes, license variation, area wording changes, incomplete histories are retained and noted. Year-specific source descriptions and PDF page numbers are in the ledger. This is a descriptive comparison, not a causal estimate controlling for all access, habitat, wildfire or season effects. The 99-hunt count requires records in all eight years but does not exclude the flagged changes.
Rates pool first-choice awards and entries; choice positions and applicant pools are kept separate. The post-ban averages include all four draws from 2023 through 2026, beginning with the first draw under the scope ban. Missing hunt-years are not zero-filled. The 2023 analysis uses the corrected report, 2023-odds_corrected_CN.xlsx. Rulebook bag limits take precedence over the inconsistent 2023 spreadsheet labels for Unit 30 and Unit 34 deer.
The commission adopted the scope ban on October 14, 2022; it took effect April 1, 2023. Hunters had notice in the 2023–24 hunting booklet before the March 22, 2023 application deadline. The ban prohibited scopes, red dots and other optical sights on muzzle-loading rifles used during muzzleloader hunts; the 2026–27 booklet allows open or peep sights. [1–4]
For the period comparisons, Hunt Smart NM divides total first-choice awards by total first-choice entries across the included hunts and years, rather than averaging individual hunt percentages. The pre-ban period is 2019–2022 and the post-ban period is 2023–2026, including the first draw under the ban. Percentage-point changes use unrounded rates before rounding the displayed result.
Hunt codes changed substantially in 2023. Hunt Smart NM matched histories using annual rulebooks, seasons, bag limits and eligibility rather than code numbers alone. The 99 complete histories include hunts with changes to seasons, bags or license supply; they are not controlled tests of the scope ban.
[1] Official October 14, 2022 commission minutes, agenda item 7 (adoption of 19.31.10), plus elk/deer rule adoption.
[2] 19.31.10 NMAC, effective-date section and 19.31.10.7(TT)(4). The restricted muzzleloader definition in (OO) is separate.
[3] 2023–24 Hunting Rules & Info: printed pages 2 (scope rule), 6 (deadline), 28–29 (arms), deer/elk hunt tables and glossary. Unit 30/34 deer tables list FAD.
[4] 2026–27 Hunting Rules & Info: open/peep sight reminder, sporting arms. The Unit 34 either-sex elk hunt is Oct. 17–21; the Unit 30 fork-antlered deer hunt is Oct. 24–28. Dates describe this season only.
[5] 2022–23 Hunting Rules & Info: restricted muzzleloader rules and Unit 52 deer hunt; Unit 36 elk table lists mature bull.
[6] Official September 2022 proposed-rule notice: documents the wider rule package. Proposed changes are not treated as proof that each change was adopted; the booklets establish the specific examples used here.
[7] Official drawing-odds report index. All draw calculations are Hunt Smart NM’s analysis of the complete reports below, not simulated results.
| Draw year | Complete report |
|---|---|
| 2019 | Download |
| 2020 | Download |
| 2021 | Download |
| 2022 | Download |
| 2023 | Download |
| 2024 | Download |
| 2025 | Download |
| 2026 | Download |
[8] Annual hunt identities were checked against the 2019–2026 rulebooks. The downloadable ledger records the code, season, bag limit, draw-report row and PDF page for each available record.
[9] Official 2023–24 elk hunting forecast: the Marquez/L-Bar expansion opened to hunting in 2023–24. Earlier Marquez hunts appear in the 2022–23 rulebook. These three histories are excluded because the hunt area expanded, rather than being treated as unchanged hunts. Hunts without any pre-2023 history are excluded from muzzleloader comparisons.
Harvest comparison
[10] Official annual harvest report archive. The analysis uses the 2019 through 2025 hunting seasons; for example, the 2025–2026 report supplies the 2025 observation. These are separate reports from the drawing-odds workbooks.
The harvest comparison follows the article's existing hunt histories and exclusions and uses public-license rows. Private-license rows and private-land elk authorizations are not mixed into the results. All 697 available in-scope hunt-years were matched to the official harvest reports. The paired comparison contains 99 histories with published rates in all seven seasons: 45 elk and 54 deer. The discontinued Unit 37 elk history remains in the underlying records but has no after-period counterpart, so it is left out of both averages in this comparison.
For each hunt, Hunt Smart NM averages the department's published annual success rates over 2019–2022 and, separately, 2023–2025. It then averages those hunt-level values, giving the same hunts equal weight in each period. This describes the average hunt, not the percentage of all hunters combined. The department's rates are rounded to whole percentages, and small hunts can fluctuate sharply. The displayed results use one decimal place; percentage-point changes are calculated before rounding.
The number of hunters submitting reports includes people who did not hunt. It is not used as a weight for harvest success. The deer reports define success among reporting license holders who went afield; a consistent active-hunter count is not published across all elk and deer reports in this period. The harvest reports also do not provide the resident/nonresident/outfitter split used in the draw analysis.
The post-ban harvest average includes every completed season from 2023 through 2025. Average success remains lower when histories with flagged bag, season or area changes are omitted as a sensitivity check. Those histories remain in the main comparison. Two duplicate deer-code entries in the 2025 source were resolved against the hunt's area and eligibility; the unused duplicate rows had no reporting hunters and no success rate. The full source rows and resolutions are preserved with the research. Some elk report dates conflict with the corresponding rulebook, so the join retains the verified annual hunt code and bag rather than silently swapping rates between seasons.
The count of hunts whose draw rate improved while reported success fell pairs each hunt’s resident draw-rate change with its own harvest change, across the same 99 histories; it is a count of hunts, not a measured relationship, and no individual hunt’s harvest change should be read as reliable on its own. These descriptive averages cannot isolate the scope rule from weather, herd conditions, access, season changes or changes in who chose to hunt. They must not be multiplied by the resident first-choice draw rate to present a measured overall chance of harvesting an animal.
| Hunting season | Elk harvest report | Deer harvest report |
|---|---|---|
| 2019 | ||
| 2020 | ||
| 2021 | ||
| 2022 | ||
| 2023 | ||
| 2024 | ||
| 2025 |